My wiki:SP, JP, JL
Contents
System Description[edit]
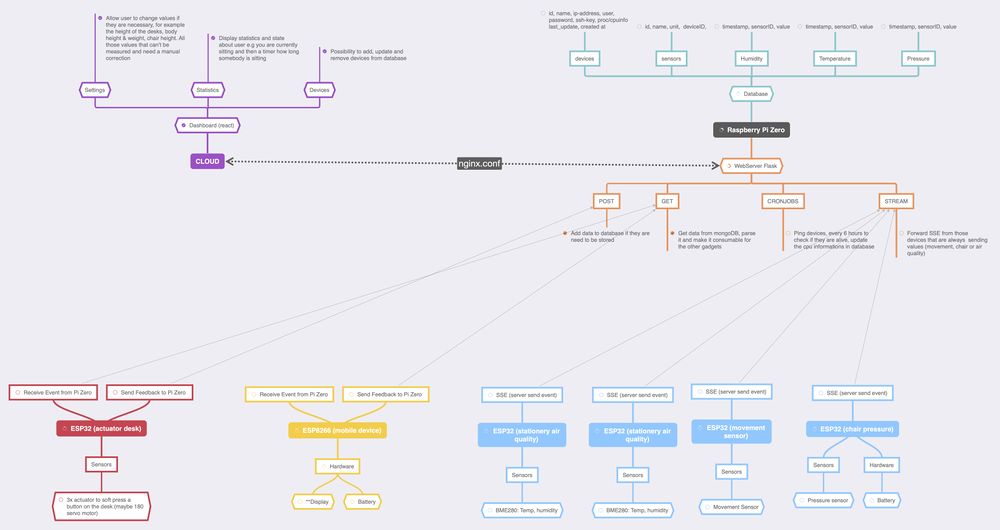
A small gadget with a display. The system tracks a users activity at his own workplace through multiple sensors and if considered necessary, changes the working environment by increasing the desk height. All proceeded actions can be seen in the display. Further, an Avatar gives feedback concerning the air quality and suggests to open or close a window for a certain time.
The system’s recorded life data and statistics from all sensors can be seen in the React Dashboard. A user will also be allowed to change given values like the height of the desk in a raised state in order to adjust to his body height.
What kind of data will be recorded by the system?
- check whether the user is sitting at his workplace (true or false)
- movement of user while sitting at his workplace (movements per minute)
- air quality (humidity, temperature)
When will the system change the working environment?
- after a certain time of sitting
- after too much body movement of the user while sitting (indicating a certain restlessness)
- inform the user to open a window (through the display)
How will the system give feedback?
- an Avatar with the following states: Happy or unhappy
- Text
System Architecture[edit]
Relation to Digital Health[edit]
- Too much sitting is the new smoking. To avoid this the user has to stand up for a certain time over the day, so he’s not sitting all day long
- If we spend close to 30% of our time in enclosed spaces at work, the creation of healthy air quality is essential
Evaluation[edit]
Survey with health related and system related questions:
- Do you feel more energetic since you included the system?
- Does standig up annoy you?
- Do you feel the change in air quality?
- ...
List of Components[edit]
- [arrived] 3x air quality sensor: https://www.exp-tech.de/sensoren/gas/8400/adafruit-sgp30-air-quality-sensor-breakout-voc-and-eco2
- [ordered/we might have some in the lab] 3x Movement Sensor: https://www.reichelt.de/raspberry-pi-infrarot-bewegungsmelder-hc-sr505-debo-hc-sr505-p266046.html?&trstct=pos_0&nbc=1
- [ordered] 5x Pressure Sensor: https://www.reichelt.de/arduino-drucksensor-20-g-bis-10-kg-ard-sen-pressure-p284398.html?&trstct=pos_0&nbc=1
- [ordered] 2x Display: https://www.reichelt.de/raspberry-pi-display-lcd-20x4-gelb-4-buttons-hd44780-rpi-lcd20x4-4byl-p242692.html?&trstct=pos_10&nbc=1
- [ordered/we might have some in the lab] 8x Esp32: https://www.reichelt.de/nodemcu-esp32-wifi-und-bluetooth-modul-debo-jt-esp32-p219897.html?&trstct=pos_1&nbc=1
- [ordered/we might have some in the lab] 4x Esp8266: https://www.reichelt.de/nodemcu-esp8266-wifi-modul-debo-jt-esp8266-p219900.html?&trstct=pos_1&nbc=1
- [ordered/we might have some in the lab] 6x Micro Usb Cable: https://www.reichelt.de/sync-ladekabel-usb-a-micro-usb-2-0-m-goobay-38666-p268010.html?&trstct=pos_11&nbc=1
- [arrived] 2x Linear Servo: https://www.conrad.de/de/p/agf-rc-mini-servo-c1-5csl-r-linear-servo-getriebe-material-plastik-stecksystem-micro-jst-2100691.html
- [already in the office] 4x Small Powerbank + equipment to connect to Esp8266: ?
Milestones[edit]
1st Milestone: - 27.01 (Done)
- Task:
- install PyCharm / Thonny
- burn sensors with PyCharm / Thonny
- get feedback from the sensors
- send data to webserver
- think about how the sent data can be converted into useful information
- Minimum: setup sensors, setup DB, setup web server.
- Nice to haves: web server interface: showing live data from all elements.
2nd Milestone: 28.01- 01.03
- Task:
- motor control
- monitor setup
- Communication between all elements
- user interface
- Risk:
- motor can not press the button (too weak)
- Minimum: motor press button, information on the monitor: air quality, informatioin to the user: time to stand up, all elements work well separately
3nd Milestone: 01.03 - 12.03
-
Task:
- Video
- Teaser
- diary
- 4 pages system description (including code, photos, schematics, etc.)
- Presentation preparation
